
YouTube
Most Aggressive States Against the Coronavirus
According to the World Health Organization, the primary way that coronavirus (COVID-19) spreads is through close interaction with other people. If people come into contact with droplets exhaled or coughed out by infected people, they are at risk of getting the virus. In response, the U.S. Centers for Disease Control and Prevention has recommended that Americans use “social distancing.” This includes canceling large events and staying at least two meters away from others when possible, among other measures to limit close contact.
Many states have taken the CDC’s advice and have legally enforced social distancing, to the point of banning large gatherings and mandating that restaurants and bars close in some cases. Other states have focused on laws ensuring greater funding for combating the pandemic or guaranteeing that treatment is covered by insurance. Some states have even taken hygiene into their own hands – for example, New York is manufacturing its own hand sanitizer to deal with shortages.
In order to determine the states that are most and least aggressive in their efforts to limit exposure to coronavirus, WalletHub compared the 50 states and the District of Columbia across 35 unique metrics. Our data set ranges from tested cases of COVID-19 per capita and state legislation on the pandemic to the uninsured population and share of the workforce in affected industries. Read on for the ranking and a complete description of our methodology.
Document
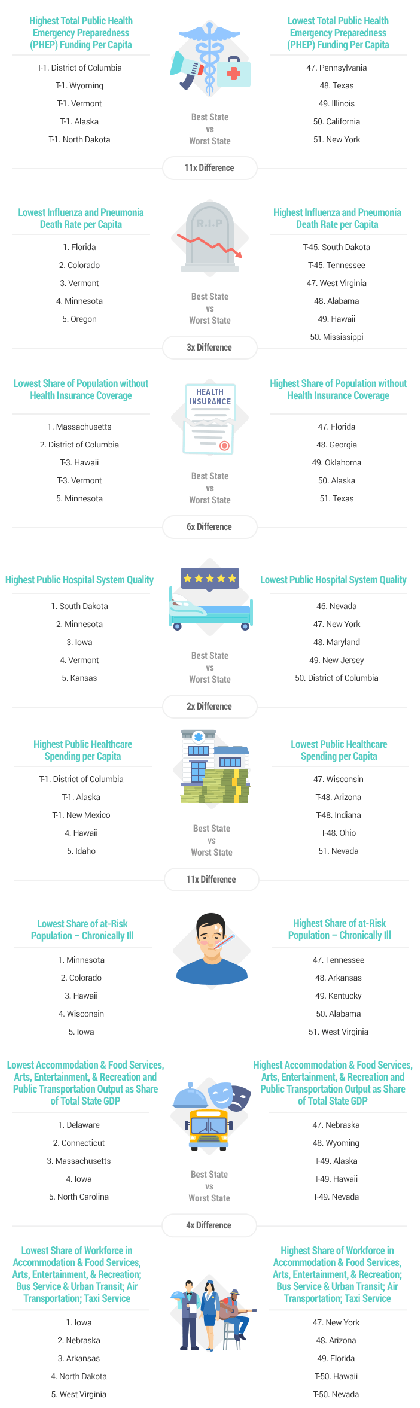
Main Findings
Source:
WalletHubState with the Most Aggressive Measures in Limiting Virus Exposure
Courtesy Photo
FINDINGS. Note: Rankings are based on data available as of 5 p.m. EST on Monday March 16.
Methodology
In order to identify the states that have taken the most aggressive measures in limiting virus exposure, WalletHub compared the 50 states and the District of Columbia across three key dimensions, “Prevention & Containment,” “Risk Factors & Infrastructure” and “Economic Impact.”
We evaluated those dimensions using 35 relevant metrics, which are listed below with their corresponding weights. Each metric was graded on a 100-point scale, with a score of 100 representing the highest value.
We then determined each state and the District’s weighted average across all metrics to calculate its overall score and used the resulting scores to rank-order our sample.
Prevention & Containment – Total Points: 60
State and Local Public Health Laboratories per Capita: Half Weight (~1.15 Points)
Tested Cases of COVID-19 per Capita: Double Weight (~4.62 Points)
Share of Confirmed Over Tested Cases of COVID-19: Double Weight (~4.62 Points)
Deaths Due to COVID-19 per Capita: Triple Weight (~6.92 Points)
Epidemiology Workforce per Capita: Half Weight (~1.15 Points)
Total Public Health Emergency Preparedness (PHEP) Funding Per Capita: Full Weight (~2.31 Points)
Emergency Centers and Services per Capita: Double Weight (~4.62 Points)
Note: This composite metric measures both the number of emergency and relief services and the number of freestanding ambulatory surgical and emergency centers per capita.
Share of Workers with Access to Paid Sick Leave: Full Weight (~2.31 Points)
States Who Have Restricted Travel: Full Weight (~2.31 Points)
Note: This binary metric measures state employee restricted travel/restricted state travel enactment by state.
States Who Banned Large Gatherings to Slow Coronavirus Spread: Double Weight (~4.62 Points)
Note: This metric measures the presence or absence of policies that have banned large gatherings in a state.
States Who Announced Statewide School Closures: Double Weight (~4.62 Points)
States Who Have Activated National Guard in Response to Coronavirus Pandemic: Double Weight (~4.62 Points)
States Who Have Closed Restaurants and Bars to Minimize Coronavirus Spread: Triple Weight (~6.92 Points)
States Who Are Recommending Statewide Curfew to Minimize Coronavirus Spread: Triple Weight (~6.92 Points)
States Legislation Responding to COVID-19: Full Weight (~2.31 Points)
Note: This metric measures the presence or absence of state legislation responding to COVID-19 by state.
Risk Factors & Infrastructure – Total Points: 20
Influenza and Pneumonia Death Rate: Double Weight (~1.86 Points)
Infectious Disease Incidence Rate: Full Weight (~0.93 Points)
Note: Rates of infectious diseases, continue to rise despite the readily available prevention and treatment options. Three common diseases, each with different modes of transmission, prevention strategies and treatment options are included in this composite metric: chlamydia, pertussis and salmonella.
Poverty Rate: Double Weight (~1.86 Points)
Population Density: Double Weight (~1.86 Points)
Note: This composite metric measures both state population density and urban population density.
Life Expectancy: Half Weight (~0.47 Points)
Share of Uninsured Population: Full Weight (~0.93 Points)
Hospital Beds per Capita: Full Weight (~0.93 Points)
Public Hospital System Quality: Double Weight (~1.86 Points)
Note: This metric is based on data from the Centers for Medicare & Medicaid Services.
Access to Communication Infrastructure: Full Weight (~0.93 Points)
Note: This composite metric measures the share of households with access to broadband internet and share of households with cellular data subscriptions.
Share of Homes Lacking Access to Basic Hygienic Facilities: Double Weight (~1.86 Points)
Note: This composite metric measures the share of homes with inadequate plumbing, with inadequate kitchen facilities or that are severely overcrowded.
Food Insecurity Rate: Double Weight (~1.86 Points)
Public Healthcare Spending per Capita: Full Weight (~0.93 Points)
At Risk Population – Share of Elderly Population: Double Weight (~1.86 Points)
At Risk Population – Chronically Ill: Double Weight (~1.86 Points)
Note: This metric refers to population 18 years and older suffering from: arthritis, asthma, skin cancer or other types of cancer, chronic kidney disease, chronic obstructive pulmonary disease, coronary heart disease, or diagnosed diabetes. It also includes the population that has had a stroke.
Economic Impact – Total Points: 20
Accommodation & Food Services; Arts, Entertainment, & Recreation; and Public Transportation Output as Share of Total State GDP: Double Weight (~4.44 Points)
Share of Workforce in Accommodation & Food Services; Arts, Entertainment, & Recreation; Bus Service & Urban Transit; Air Transportation; Taxi Service: Double Weight (~4.44 Points)
Part-time to Full-time Employment Workforce Ratio: Full Weight (~2.22 Points)
Share of Wage and Salary Workers Paid at Hourly Rates: Full Weight (~2.22 Points)
Share of Employment from Small Businesses: Full Weight (~2.22 Points)
States Who Have Enacted Budget Legislation in Response to COVID-19: Double Weight (~4.44 Points)
Note: This metric measures the enactment of budget legislation changes in response to COVID-19 by state.
Sources: Data used to create this ranking were collected from the U.S. Census Bureau, Bureau of Labor Statistics, U.S. Bureau of Economic Analysis, Association of Public Health Laboratories, The COVID Tracking Project, Centers for Disease Control and Prevention, Pew Research Center, National Governors Association, Editorial Projects in Education, National Conference of State Legislatures, United Health Foundation, American Medical Association, The Health Resources and Services Administration, Centers for Medicare & Medicaid Services, Feeding America, U.S. Small Business Administration and news reports.