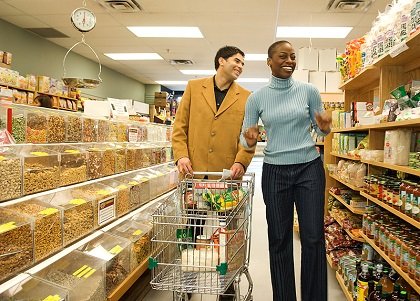
NNPA — With a current buying power of $1 trillion, manufacturers and marketers should be paying careful attention to the shopping patterns of African American consumers.
The latest report on black consumers, Resilient, “Receptive and Relevant: The African-American Consumer 2013 Report,” illustrates how much of that spending breaks down: Our annual retail spending makes up 87 percent of the total market retail spending, while retail spending for the Total Market accounts for 70 percent. This is a narrow gap in retail spending between Blacks and the Total Market which indicates our importance as Black consumers. We shell out 30 percent more of our annual income than the Total Market as well.
So now that you have a glimpse as to where the bulk of our household income is spent, let’s take a look at where that spending occurs. Annually, African Americans, make 154 shopping trips, which is eight trips more than other groups. We average, 20 trips to dollar stores, seven trips more; 15 trips to convenience/gas stores, which is two more than any other group and 15 trips to drug stores, which is one more than any other groups. Less time is spent at grocery stores, with three fewer trips. The exception to grocery store shopping, though, is with blacks who earn upwards of $100,000 annually. We also make three fewer trips to warehouse stores and two fewer trips to mass merchandisers than the Total Market. However, more upper-income blacks (73 percent) shop at warehouse clubs than non-Blacks annually.
The Centers for Disease Control has identified a phenomenon specific to some of our communities known as “food deserts” or “retail deserts.” We all know you won’t find some large chains in some urban areas. And, some existing grocery stores simply don’t carry the freshest, most nutritious foods. This might explain the occurrences and store preferences of food shopping trips in the African-American community. As the data also shows, African Americans tend to frequent retail stores located in our communities. Consequently, there is an opportunity for expansion of both affordable, quality product variety and actual stores in our neighborhoods. In an effort to try to attack this “food desert” trend, the Whole Foods chain, plans to build a store in Chicago’s Englewood neighborhood.
Another retail area that’s big for us is ethnic health and beauty care products – I know, no shocker there, right? We spend more than nine times more than any other demographic on Ethnic Hair and Beauty Aids. Sure, of course there are other hair care products on the shelves, but those products are not identified as ethnic, but they can lead to tremendous market growth opportunities, as blacks’ hair care spending within traditional CPG retailers is underdeveloped compared to the total market. In fact, 46 percent of Black households shop at Beauty Supply Stores and have an average annual total spend of $94 on products at these stores.
Among other edible and non-edible products, the report shows that on average, African Americans also purchase more unprepared meat and frozen seafood, dry vegetables and grains, refrigerated juices and drinks (in addition to those that non-perishable and can have an extended shelf life), feminine hygiene products, fresheners and deodorizers. And, that’s just a few of the categories that we tend to over-index. On the other hand, the insights show that we spend less money on the range of dairy products (milk, yogurt, etc.) on the edible side and this could be because many of us are lactose-intolerant; and categories like hair care (not to be confused with Ethnic HABA), some magazines with selected titles plus lawn and garden products round out the non-edible list.
African Americans are brand loyal consumers, but like other consumer groups; we enjoy value (e.g. better per-item pricing) and spend 18 percent of our retail dollars on private label brands. You know – the store brands. I am always fascinated by how varied different groups’ preferences tend to be. For instance, in the private label category, disposable diapers rank as the most popular item for us; but they rank fifth on the store brand list of White non-Hispanics. Again, this is an opportunity for marketers who are paying attention.
And here’s one of the new areas that we explored for this year’s report. All of us make fast food runs from time to time – some of you I know, more often than others, but hey, there is no judgment here. I am sure our busy schedules and multiple mouths to feed at home, make hitting those drive-thrus a lot easier. So we took a look at our preferences for fast food or Quick Service Restaurants (QSRs) over the last three months.
These are the top five Black household QSRs in comparison to other U.S. households:
1.McDonald’s (65% vs. 60%)
- Burger King (44% vs. 36%)
- Subway (43% vs. 40%)
- KFC (37% vs. 26%)
5.Wendy’s (36% vs. 30%)
If you would like to learn more, I invite you to visit our website at www.nielsen.com for the full report. I would love to hear from you so we can keep the conversation going. So, hit us up on Twitter or Facebook. In the meantime, remember how powerfully relevant you are with every consumer choice you make.
Cheryl Pearson-McNeil is senior vice president of Public Affairs and Government Relations for Nielsen. For more information and studies go to www.nielsen.com. Follow Us on Twitter @NielsenKnows #AAConsumer13. Like us on Facebook: wwwfacebook.com/NielsenCommunity
